

Summary
Councilmember Alex Pedersen (District 4, Northeast Seattle) released new survey results revealing the views of Seattle residents on pressing transportation and related topics, including 75% support for impact fees to help pay for transportation infrastructure.
Councilmember Pedersen Urges Policymakers to Listen to Results of the Survey
SEATTLE – Councilmember Alex Pedersen (District 4, Northeast Seattle) released new survey results revealing the views of Seattle residents on pressing transportation and related topics, including 75% support for impact fees to help pay for transportation infrastructure. Conducted May 5 through May 13, 2023, the survey asked several questions of 1,000 Seattle adults, including 500 live interviews by SurveyUSA, an independent professional firm used recently by the Seattle Times. With so many respondents, the survey firm reports a margin of error of less than 4 points (plus or minus).
“I believe City Hall can hear Seattle residents more clearly and frequently with professional surveys that gather statistically valid input to cut through social media echo chambers and go beyond paid lobbyists and interest groups,” said Councilmember Alex Pedersen who obtained the survey. “Just as several other local governments poll their residents, Seattle City Hall can benefit from conducting its own statistically valid surveys, so we hear directly how the broader population is feeling about key issues, such as how best to pay for transportation priorities.”
In Seattle, surveys are typically conducted by political campaigns and not available to the public or policymakers. One recent exception is the Seattle Metropolitan Chamber of Commerce, which periodically conducts a statistically valid survey (“The Index”) and generously makes the results available to the public. The added benefit of City Hall also conducting its own surveys, however, is that government officials will choose the questions and the frequency of asking them.
Here are some key findings from my May survey:
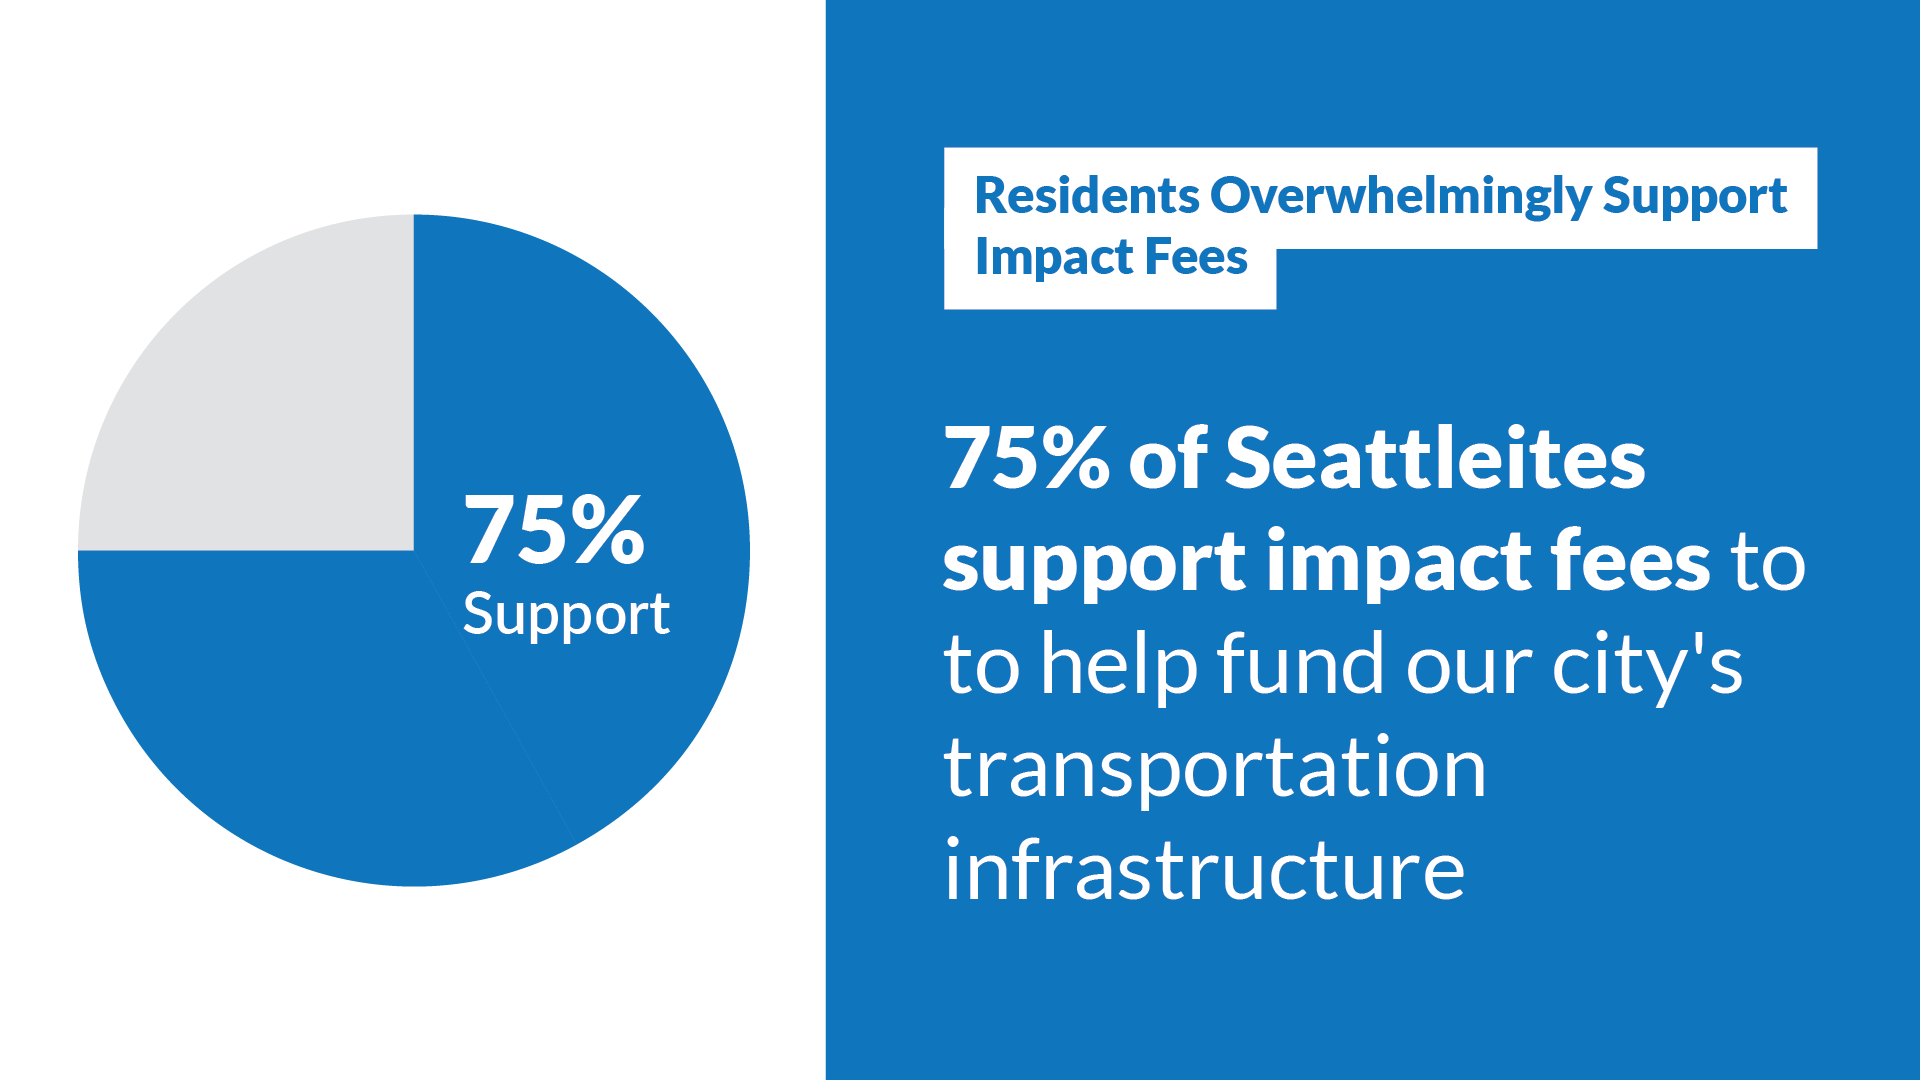
IMPACT FEE SUPPORT: For this survey, the question that earned the largest super-majority of 75% was about a new funding source for transportation infrastructure:
The survey question: “Seattle may consider imposing fees on new real estate development projects to help pay for the city’s growing needs for transportation infrastructure. (For example, a real estate developer may have to pay $8,000 to the City government on a condominium project the developer hopes to sell for $800,000.) Would you support or oppose these transportation impact fees on new real estate developments to help pay for transportation infrastructure?
- Support: 75% (includes 42% strongly support)
- Oppose: 18%
- Not sure: 7%
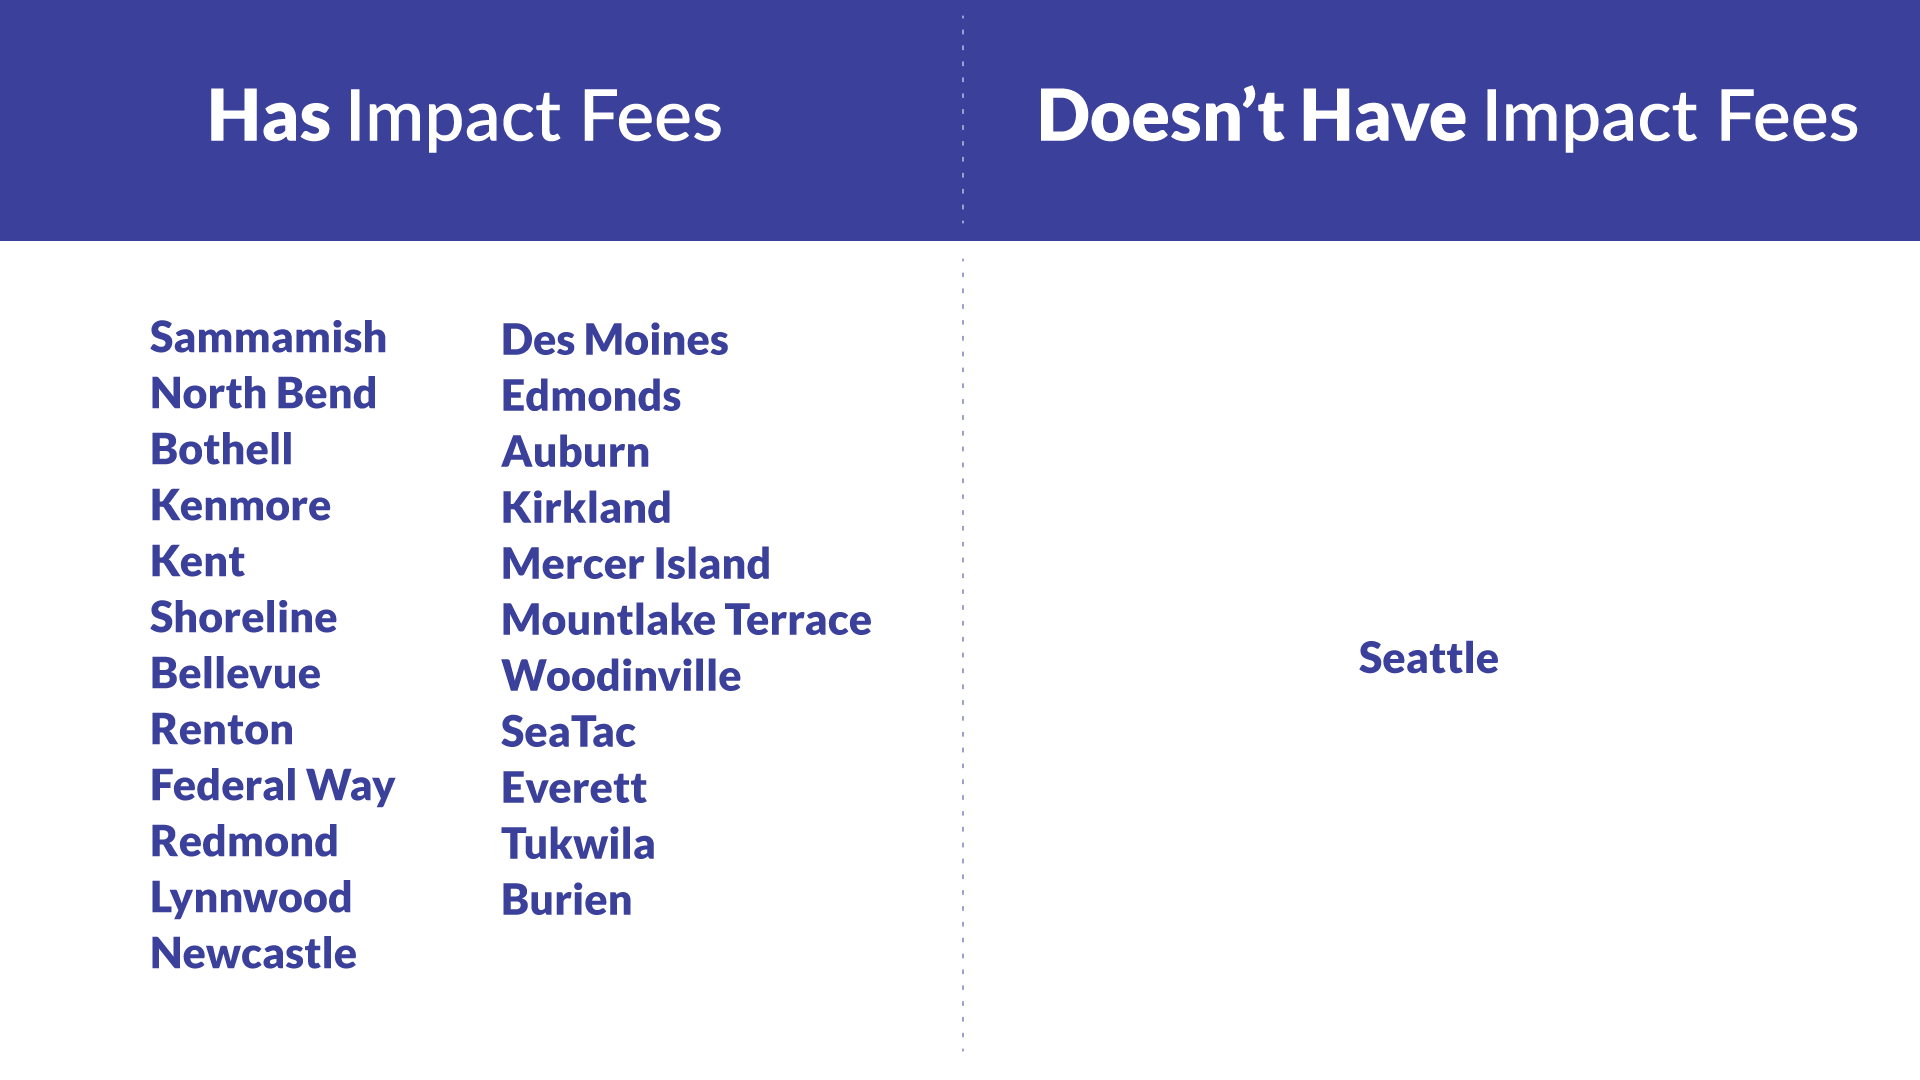
Notably, no other public survey has asked this important question about impact fees, which are already collected in approximately 70 other Washington State cities. (Currently, a group of for-profit real estate developers is challenging City Hall’s efforts to pursue impact fees to pay for transportation infrastructure, which means City Hall would otherwise need to increase regressive sales taxes and/or property taxes.) Low-income housing and child care can be exempt from the impact fees.
Impact fees, as authorized by State law, are common among dozens of Seattle’s peer cities. Seattle’s lack of impact fees makes it a regressive outlier:
TRANSPORTATION PRIORITIES: The survey also found that the top 3 transportation priorities receiving majority support were: fixing roads, supporting transit, and fixing bridges. The survey question: “Thinking now about transportation in Seattle. Of the following, which three transportation investments do you think are the most important for Seattle to make?”
- Fixing potholes and repaving roads for all vehicles: 66% picked among their top 3.
- Supporting buses and other public transit: 64% picked among their top 3.
- Fixing Seattle’s older bridges: 52% picked among top 3.
- Installing new sidewalks and crosswalks: 30% picked among top 3.
- Building bike lanes for safer streets: 27% picked among top 3.
- Prioritizing freight to transport food, household products, and other items: 17% picked among top 3.
- Something else: 6%
- None of the above: 1%
“As Chair of the City’s Transportation Committee, I remain committed to Seattle’s Vision Zero safety goals to eliminate traffic fatalities and serious injuries in addition to pursuing other priorities called for by Seattle residents,” said Councilmember Pedersen.
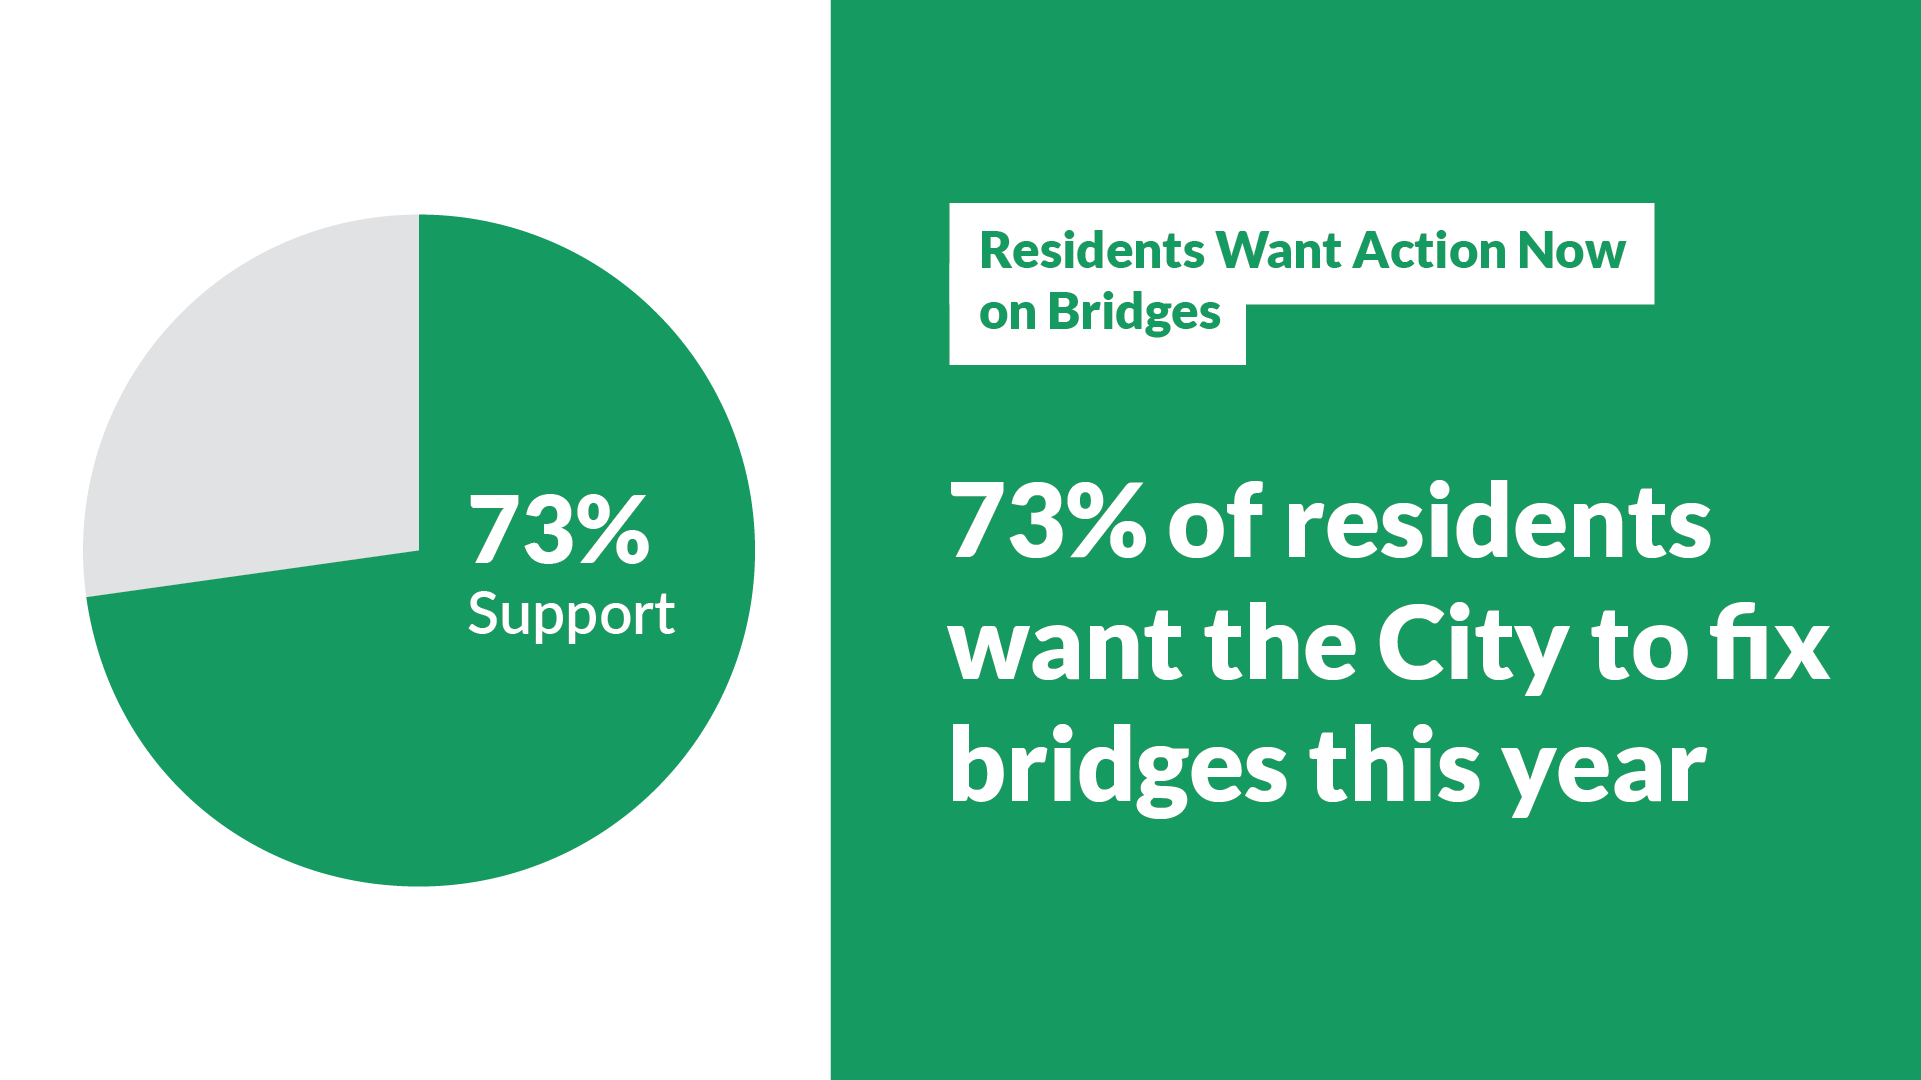
BRIDGES NOW: The question that garnered the second highest super-majority showed people want City Hall to take quicker action to fix bridges. The survey question: “After the West Seattle Bridge cracked and closed, the city ordered an audit of all Seattle bridges, which found several bridges in poor condition. Do you think the Mayor and the Seattle Department of Transportation should do more to fix Seattle’s worst bridges this year or should they wait until they have additional data on all bridges?”
- Fix Bridges This Year: 73%
- Wait for Data: 21%
- Not Sure: 6%
(Interesting “cross tab”: Even for people who did not pick bridges among their top 3 transportation priorities, 67% said fix bridges this year.)
More About This Survey:
In addition to several other timely questions on local government topics, the independent survey firm gathered standard demographic information on each of the 1,000 respondents, such as age, gender, race, income, etc. This enables the public and policymakers to cross-reference the answers on the topical questions with the demographic information. For example, these “crosstabs” show that respondents who have lower incomes, residents who live in South Seattle, students, and retirees were much more likely to choose filling potholes / repaving roads over other transportation priorities.
Links:
- Here’s the link to the full survey as provided by the independent survey firm, including all toplines results and crosstabs:
- Here’s a more user-friendly PDF of the full survey that should be easier to print, including all topline results and crosstabs:
- For more information about the popular impact fees for transportation, CLICK HERE for the City Council’s website and CLICK HERE for my Councilmember blog. For the March 17, 2023 presentations to the Transportation Committee, CLICK HERE and HERE.
###